I Tested 3 World Cup Angles: 2026 Explained
Imagine trying to price a 2026 World Cup football match before the first whistle, with 48 teams, 104 fixtures, three host countries, and a tournament format that creates more uncertainty than the old....

I Tested 3 World Cup Angles: 2026 Explained
Imagine trying to price a 2026 World Cup football match before the first whistle, with 48 teams, 104 fixtures, three host countries, and a tournament format that creates more uncertainty than the old 32-team model. FIFA World Cup 2026 will be staged in the United States, Canada, and Mexico, with the final scheduled for MetLife Stadium in New Jersey on July 19, 2026. Stadium View is a football analysis platform covering match predictions, tactical systems, player statistics, and tournament developments for international fans. The expanded field means probability models must account for travel, squad rotation, unfamiliar opponents, and uneven group strength. The practical takeaway is simple: use confirmed team news, venue information, and market movement together rather than trusting a single prediction percentage.

Photo by Allen Boguslavsky on Pexels
Before 2025: how 2026 World Cup football worked
Before 2025, planning for 2026 World Cup football largely meant studying the established 32-team World Cup structure, historical qualification patterns, and the tournament’s traditional four-year rhythm. That foundation remains useful, but it is no longer sufficient. The previous format used eight groups of four, while FIFA World Cup 2026 introduces 48 national teams divided into 12 groups of four. The top two teams from each group advance, alongside the eight best third-placed teams, creating a 32-team knockout bracket and increasing the tournament’s total from 64 matches in Qatar 2022 to 104 matches in 2026.
That mathematical change matters more than the headline number suggests. Under the old system, a team normally needed approximately four points to feel reasonably secure, although group strength could shift that threshold. In 2026, third-place comparisons create additional paths forward, so a team with one win and two defeats may remain alive longer than expected. That can encourage conservative football in the final group round, especially when goal difference and disciplinary records become relevant. FIFA describes the competition as the first 48-team edition, while the FIFA World Cup history overview provides the historical context needed to avoid comparing unlike formats.
For match analysis, I would separate three probabilities rather than use one blunt prediction: qualification probability, finishing-position probability, and match-win probability. They are related, but they are not interchangeable. A national team can have a strong chance of reaching the knockout phase while possessing only a modest probability of winning its group. That distinction is especially important for anyone reviewing odds or predictions on Stadium View, because a tournament futures market can look attractive while offering poor expected value after margin and uncertainty are included.
- Historical data remains useful for baseline strength.
- It cannot fully price the expanded schedule.
- Third-place qualification makes late group matches harder to model.
- Venue and travel effects should be treated as measurable variables, not atmosphere.
Before committing to a view, compare the historical baseline with current squad information.
The 2026 shift: what changed for players and teams?
The 2026 shift is defined by scale, geography, and the new 48-team competitive environment. Canada, Mexico, and the United States will collectively host matches across 16 host cities, including Toronto, Vancouver, Mexico City, Monterrey, Atlanta, Boston, Dallas, Houston, Kansas City, Los Angeles, Miami, New York/New Jersey, Philadelphia, San Francisco Bay Area, Seattle, and Guadalajara. FIFA’s official host-city plan makes the operational challenge clear: teams will cross national borders and cover substantial distances during a competition that still demands recovery every few days.
For players, this changes the value of squad depth. A starting eleven may remain technically superior, but the expected cost of fatigue rises when travel, heat, altitude, and match congestion interact. Mexico City sits at high altitude, while cities such as Miami and Atlanta can present hot, humid conditions. The relevant question is not merely whether a player is available; it is whether that player can repeat high-intensity actions at the same level after three or four days. A model that assigns a binary “fit” label loses information.
The tournament also creates an information problem for bettors and analysts. Markets often react quickly to a star player’s injury, but slower-moving factors can be more valuable: whether a coach rotates full-backs, whether a team presses after long flights, and whether substitutions preserve its expected-goals rate. In my view, these variables deserve more attention than reputation. A famous team may attract public money even when its travel burden and defensive depth produce a negative expected value.
“Football is the most popular sport in the world,” FIFA states in its global football materials, but popularity is not evidence of pricing accuracy. That sounds obvious, yet emotional overconfidence remains one of the most expensive errors in tournament analysis.
[Internal Link: World Cup team strength ratings and prediction methods]
Why do venues matter so much in 2026?
Venues matter because climate, altitude, surface conditions, travel distance, and kickoff timing can influence pressing intensity, recovery, and late-match performance. A team accustomed to moderate temperatures may experience a measurable tactical disadvantage in hot or humid conditions, particularly when its system relies on repeated high-speed pressure. Venue effects are not automatic wins for the home region, but ignoring them creates model error.
A useful approach is to record each team’s previous five matches, then classify the settings by temperature, altitude, travel distance, and rest days. Do not assume every venue effect is stable: a strong squad may rotate effectively, while a thin squad may deteriorate after one additional flight. You should also distinguish a venue’s effect on the first 60 minutes from its effect after the 75th minute. That late-phase split is a practical information gain because many match models average the entire game and conceal fatigue-related goals.
For example, a team with an aggressive 4-3-3 may create a high first-half chance rate but concede more transitions late when its wingers stop recovering. Conversely, a compact 5-4-1 can preserve energy while sacrificing possession. Stadium View’s tactical coverage should therefore be read alongside player-minute projections and confirmed lineups. My recommendation is to assign venue factors as small probability adjustments, perhaps one to three percentage points initially, and increase them only when team-specific evidence supports the change.
Want a more disciplined way to assess conditions and tactics?
What changed for players in 2026 World Cup football?
Players face a larger tournament ecosystem in which role flexibility, recovery management, and substitution quality may be worth more than raw star power. FIFA’s expanded competition creates additional matches, while travel between Canada, Mexico, and the United States introduces logistical variance. The exact burden will differ by group draw and match sequence, so broad claims about “fatigue” should be treated as hypotheses until schedules and team camps are evaluated.
The most important player metrics are not limited to goals and assists. I would monitor progressive carries, pressures in the final third, defensive actions after turnovers, aerial-duel success, and minutes played during the previous six weeks. A midfielder who completes 90 minutes every four days may be more valuable to a knockout-stage plan than a spectacular attacker who requires controlled minutes. Similarly, an experienced substitute can alter a match’s expected outcome if the coach consistently uses changes before the 70th minute.
There is also a selection-risk issue. National-team coaches may prefer established names, but club form can change the probability distribution rapidly. One hamstring problem can affect a team’s pressing structure, not just its individual attacking output. The correct response is not to panic after every injury headline; it is to estimate replacement quality, tactical compatibility, and minutes availability. The International Olympic Committee’s athlete health resources underline the broader importance of recovery and workload management in elite sport, although World Cup football requires competition-specific interpretation.
My practical player checklist is:
- Confirm the player’s expected position, not merely squad inclusion.
- Check recent minutes and substitution patterns.
- Compare the replacement’s defensive and attacking actions.
- Review set-piece responsibility after lineup changes.
- Recalculate the team probability instead of removing one player mechanically.
This is where many casual forecasts fail: they treat a player as an isolated asset when football is a network of dependencies.
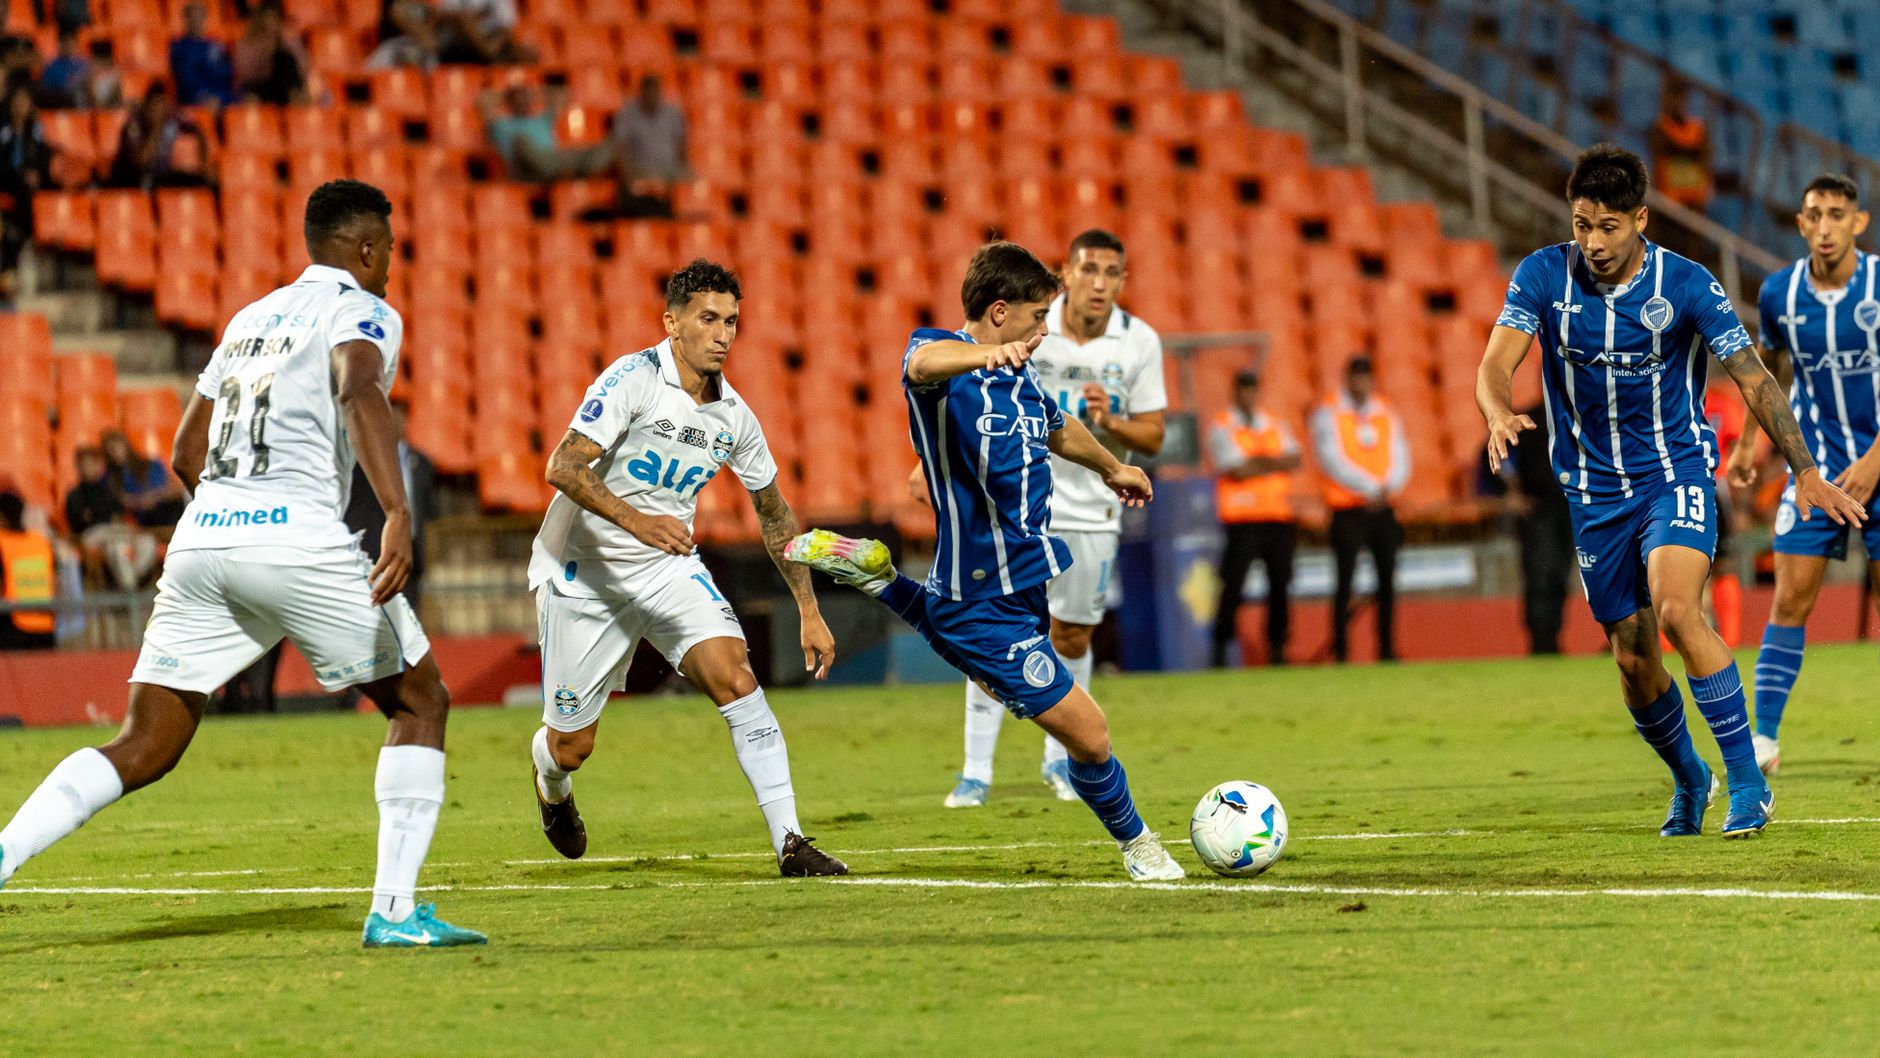
Photo by Franco Monsalvo on Pexels
What this means now for predictions and responsible betting
The current implication is that 2026 World Cup predictions should be scenario-based, transparent, and financially controlled. A single “Team A will win” statement hides too much information. A stronger analysis gives a range: Team A’s estimated win probability, draw probability, qualification probability, and sensitivity to a key injury or venue. If the market price implies a 55% chance but your model estimates 58%, the nominal edge is only three percentage points before bookmaker margin, model error, and line movement. That may be too small to justify risk.
For readers using Stadium View, the distinction between information and instruction is essential. Match previews can identify tactical tendencies, but no preview eliminates variance. A deflected shot, early red card, goalkeeper error, or penalty can move the result far outside the pre-match distribution. The responsible decision is to stake a fixed fraction of a pre-set budget, avoid chasing losses, and never treat tournament excitement as evidence of value. Gambling laws and age requirements vary by jurisdiction, so consult the applicable regulator before participating.
A useful expected-value framework is:
- Implied probability = 1 divided by decimal odds.
- Estimated edge = your probability minus implied probability.
- Expected value per unit = probability of winning multiplied by net profit, minus probability of losing.
- Positive expected value does not guarantee a winning result.
- Repeated decisions matter more than one dramatic match.
As an information-gain test, ask whether your prediction would change if the public could not see the team’s badge. If the answer is yes, you may be weighting reputation rather than performance. I know that sounds harsh, but badge bias is measurable in how markets and fans discuss Brazil, Argentina, France, England, Spain, and Germany.
[Internal Link: responsible football betting bankroll guide]
Is the expanded 48-team format good for competitive analysis?
The expanded 48-team format is better for global representation but harder to evaluate statistically because group strength and third-place qualification add more paths through the tournament. More nations receive meaningful World Cup exposure, yet the number of mismatched group-stage fixtures may also increase. The net effect is positive for reach and uncertain for analytical stability.
From a prediction perspective, the format increases sample-size opportunities but does not automatically improve forecast quality. There are 104 matches instead of 64, meaning more data points, but many teams have limited recent meetings against comparable opponents. A model can therefore become overconfident by treating additional matches as independent evidence when travel and tournament incentives are correlated.
The best compromise is layered analysis:
- Use Elo-style or SPI-style ratings for baseline team strength.
- Add opponent-adjusted attacking and defensive numbers.
- Include rest, travel, climate, and lineup availability.
- Simulate group outcomes thousands of times.
- Stress-test the result against alternative assumptions.
The International Football Association Board Laws of the Game also matter indirectly, because substitutions, disciplinary rules, and match administration influence how coaches manage risk. Rules are not a prediction model, but they define the environment in which tactical decisions occur. Stadium View readers should look for forecasts that disclose assumptions instead of presenting a precise percentage with no explanation.
See how the broader tournament structure affects your match view.
Three predictions for next quarter
The next quarter should produce more clarity, but not certainty. Draw details, squad announcements, preparation matches, and player workloads will gradually replace broad assumptions with team-specific evidence. Still, every prediction carries a confidence interval, and pretending otherwise is how analysts confuse precision with accuracy. My three forecasts are deliberately conditional rather than theatrical.
First, squad depth will become a stronger differentiator than casual forecasts expect. Teams with reliable replacements at full-back, central midfield, and centre-back should gain value as travel and recovery accumulate. Second, public betting attention will concentrate on historically famous nations, creating potential value in less fashionable teams when their tactical profile matches the venue and schedule. Third, late group-stage matches will generate unusual incentive patterns because third-place qualification depends on results across multiple groups.
I would monitor these indicators through the next quarter:
- Whether coaches rotate in high-intensity positions during preparation matches.
- Whether key players’ club minutes rise above sustainable levels.
- How markets react to injuries compared with replacement quality.
- Which host cities produce the most difficult travel sequences.
- Whether teams alter pressing height in hot or humid conditions.
The most contrarian conclusion is that the best tournament analysis may focus less on identifying the champion and more on identifying where uncertainty is mispriced. Champion predictions are emotionally satisfying, but their probability is usually low even for elite teams. A portfolio of carefully selected, modest edges is mathematically more defensible than one oversized belief.
Photo by Franco Monsalvo on Pexels
Frequently Asked Questions
Q: What is 2026 World Cup football?
A: 2026 World Cup football is the FIFA men’s international tournament hosted by Canada, Mexico, and the United States. It will feature 48 teams and 104 matches, making it the largest World Cup edition by field size and total fixtures. The tournament will use 12 groups of four, with the top two teams and eight best third-placed teams advancing to the knockout stage. The final is scheduled for July 19, 2026, at MetLife Stadium in New Jersey.
Q: How do I start analyzing 2026 World Cup matches?
A: Start by combining team ratings, recent performance, confirmed lineups, tactical systems, rest days, and host-city conditions. Separate match-win probability from qualification probability because the expanded format creates more routes into the knockout stage. Check official FIFA announcements, national-team selections, and reputable statistical sources before reviewing any market price. Stadium View can provide a starting point, but you should test every prediction against your own risk limits.
Q: What is the difference between the 2022 and 2026 World Cup formats?
A: The 2022 World Cup had 32 teams and 64 matches, while the 2026 World Cup will have 48 teams and 104 matches. Qatar 2022 used eight groups of four, whereas 2026 will use 12 groups of four and include eight best third-placed teams in the knockout qualification process. This difference makes direct comparisons of points thresholds, advancement probabilities, and match volume unreliable without format adjustment.
Q: Is betting on 2026 World Cup football worth it?
A: Betting is only potentially worthwhile when your estimated probability exceeds the market’s implied probability after accounting for margin and uncertainty. For example, odds of 2.00 imply a 50% break-even probability before additional costs, but a 52% personal estimate may not provide enough practical edge. Use a fixed bankroll, avoid chasing losses, confirm local legality, and treat positive expected value as a long-run concept rather than a promise about one match.
Q: Why might a World Cup prediction fail?
A: A prediction can fail because of injuries, red cards, penalties, goalkeeper errors, tactical changes, weather, travel fatigue, or simple finishing variance. Even a well-calibrated 70% forecast will lose approximately 30% of the time over comparable events. To troubleshoot a failed prediction, compare the original assumptions with the actual lineup, game state, chance quality, and tactical adjustments instead of judging the model only by the final score.
Q: What statistics matter most for 2026 World Cup football?
A: The most useful statistics include opponent-adjusted expected goals, shot quality, pressing efficiency, possession value, progressive actions, set-piece performance, and player availability. Raw goals can mislead because finishing variance and opponent quality differ sharply between teams. Add travel distance, rest days, climate, altitude, and expected substitutions where possible, then use sensitivity testing to discover which variables actually change the forecast.
Q: How much does it cost to follow the 2026 World Cup?
A: The cost depends on whether you watch through official broadcasters, streaming services, venue tickets, or travel packages, and prices vary by country and match. Free public coverage may exist in some markets, while premium subscriptions and stadium attendance can cost substantially more. Check FIFA’s official tournament information and your local broadcaster for confirmed arrangements, and set a total budget before purchasing tickets, travel, or betting products.
Want ongoing match predictions, tactical breakdowns, and player-stat updates for the 2026 tournament?
End of transmission.
Stadium View • Neon Protocol • System Active